
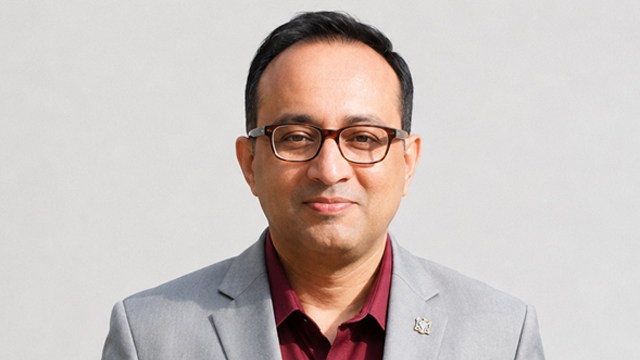
Intro: India stands at an economic crossroads where the choices made today will shape the opportunities, resilience and prosperity of its people for years to come. In this exclusive interview for Indiastat, senior journalist Mahima Sharma speaks to Shambhu Ghatak, Deputy Vice President & Economist at Systematix Group about the forces that should be shaping India’s economic future. This week's Socio-economic Voices takes the difficult questions policymakers, businesses and citizens must confront as the country seeks to build a stronger, more inclusive and sustainable economy. Read on…
MS: India has shifted its GDP base year to 2022–23 and is adding newer data sources and surveys. Should India now build one integrated economic dashboard tracking growth, jobs, consumption and living standards—instead of relying on separate datasets?
SG: There is an old debate surrounding Gross Domestic Product (GDP) whether it accurately measures the income, well-being and environmental sustainability of a nation as a whole. Heterodox economists have pointed out that simply measuring GDP ignores environmental destruction, unpaid care work and rising inequality. On 7 May, 2026, the UN Secretary-General’s High-Level Expert Group on Beyond GDP unveiled a pioneering global blueprint designed to help nations measure progress past traditional GDP. The blue print was titled Counting What Counts A Compass of Progress for People and Planet, the report introduces a universal indicator dashboard to serve as a modern compass for sustainable human and planetary development. Instead of relying solely on GDP, the United Nations High-Level Expert Group has proposed measuring progress as equitable, inclusive and sustainable well-being of people and the planet.
At its core is a practical dashboard of 31 indicators built around four pillars: foundational principles (peace, human rights and respect for the planet), current well-being (covering income, health, education, security, life satisfaction, social cohesion, institutions and environmental quality), equity and inclusion (inequality, poverty and disparities) and sustainability and resilience (stocks of produced, human, social, institutional and natural capital).
Given that almost half the indicators already exist in the Sustainable Development Goals framework, so countries can start using the dashboard immediately. The approach keeps GDP as a useful economic measure while adding the missing dimensions that show whether growth truly improves lives and can last for future generations. The acceptance of the High-Level Expert Group’s proposal for a dashboard of 31 indicators would ultimately be decided by the Member States of the United Nations.
Previously, the human development approach to development shifted the focus from pure economic output to people’s capabilities. The Stiglitz-Sen-Fitoussi Commission (formally the Commission on the Measurement of Economic Performance and Social Progress) was set up in 2008 at the request of French President Nicolas Sarkozy. The Commission’s central recommendation was, "(T)he time is ripe for our measurement system to shift emphasis from measuring economic production to measuring people’s well-being. And measures of well-being should be put in a context of sustainability."
It needs to be added that the degrowth movement globally originated in Europe as an anti-systemic socio-political movement that critiques GDP-centric economic growth, consumerism and capitalist expansion. It advocates for a downscaling of production and consumption toward a sustainable level, prioritizing ecological well-being, equity, sufficiency and shared human values over technology and market efficiency.
Regarding the GDP measurement, I would like to add that the quality of India's GDP data is significantly compromised by the lack of a recent national census, which has not been conducted since 2011. Large-scale national surveys, such as the Household Consumption Expenditure Survey (HCES), rely on the census to provide an accurate sampling frame. Without up-to-date demographic data, these surveys suffer from coverage errors and fail to reflect key structural shifts like the extent of urbanisation and changing consumption patterns. Furthermore, applying outdated Census weights to current survey responses leads to biased statistical estimates. Because these survey insights directly feed into revising the GDP base year, the Index of Industrial Production (IIP) and the Consumer Price Index (CPI), the missing Census ultimately undermines the reliability and accuracy of India's official GDP figures.
For a large country like India, both national and sub-national level (like state, district) data should be made available by the government.
MS: India’s June 2026 unemployment rate was 5.5%, while the overall LFPR was 54.4% and female LFPR was 32.7%. Is India’s bigger problem unemployment—or the large share of people not participating in the labour market? What is the fastest route to more productive employment?
SG: Greater participation in the labour force would raise the unemployment rate only if the new entrants fail to find jobs quickly; if they secure employment, the rate can remain stable or even decline. The unemployment rate is low in India because disguised unemployment or underemployment is not counted. There is no option for a poor person not to work even if the wages are low or the work is demeaning. As a result, the measured open unemployment rate is moderate, while a large share of the workforce remains in low-productivity activities.
Unlike modern capitalist countries in the North, India has a vast pool of workers. There is no shortage of labour, skilled, semi-skilled or unskilled. There is, of course, a shortage of demand for labour coming from the industry side. From the perspective of workers, there is a shortage of good-quality jobs that offer a decent wage, social security, leave, safe work environment and other benefits. Target 8.5 of SDG 8 focuses on achieving full and productive employment, decent work for all women and men, including young people and persons with disabilities and ensuring equal pay for work of equal value by 2030.
According to World Bank data, India’s female labour force participation rate (LFPR) was 32.4% in 2025 — well below the global average of 48.9%. Globally, the rate has edged down over the long term, falling from 51.2% in 1990 to 48.9% in 2025, with a temporary drop to 47% in 2020 during the pandemic. India’s trajectory has been more volatile: starting at 30.3% in 1990, it rose modestly to a peak of 34.9% in 2005, then declined steadily to a low of 26.0% in 2020. Since then it has recovered, climbing back to 32.4% by 2025.
India’s low female labour force participation rate (FLFPR) is driven by a complex interplay of:
Key contributing factors:
While a higher participation in the labour force certainly indicates progress towards attaining Target 5.5 of SDG 5, which is the ratio of female to male LFPR (15-59 years) – 0.52 in 2025, it needs to be seen whether higher FLFPR leads to a double burden of work for women – paid work in formal jobs and unpaid work at their homes. Because unpaid domestic and care work falls outside the formal boundary of economic activity in national accounting, the substantial workload carried out primarily by women remains statistically invisible in standard LFPR metrics, a key structural issue captured separately in Time Use Surveys (TUS) rather than the Periodic Labour Force Survey (PLFS).
MS: Research from July 2026 cited recent estimates that extreme heat reduced incomes of labour-intensive workers by up to 9% in 2024. Should heat protection now be treated as economic infrastructure? What should India’s first national heat-and-productivity policy prioritise?
SG: SDG Target 8.8 under Goal 8 calls for the protection of labour rights and the promotion of safe and secure working conditions for all workers, including migrant workers—especially women migrants—and those in precarious employment. Yet none of the official indicators currently used in India specifically measures protection from heat at the workplace. When countries gather at the United Nations in 2030 to shape the next development agenda, it is hoped that protection from extreme heat—both at work and in people’s homes—will be explicitly included.
Global warming poses risks to every country. The developed nations of the Global North should therefore share the financial responsibility with the Global South so that the temperature goals of the 2015 Paris Agreement—holding the rise in global average temperature to well below 2°C above pre-industrial levels and pursuing efforts to limit it to 1.5°C—can be achieved.
MS: India’s core-sector output grew 5% in June 2026. Iron ore surged 43.9%, while electricity and cement grew 9.8% each; crude oil, natural gas, fertiliser and refinery output declined. Does this point to a mismatch between infrastructure expansion and broader productive capacity? If so, what should be the next steps ahead?
SG: Compiled and released every month by the Office of the Economic Adviser (DIPP), the Index of Eight Core Industries (ICI) serves as a vital advance indicator of India’s fundamental industrial health, preceding the broader Index of Industrial Production (IIP) by roughly twelve days. The index measures production performance across eight critical sectors—coal, crude oil, natural gas, petroleum refinery products, fertilizers, steel, cement and electricity—using Laspeyres' weighted arithmetic mean formula based on administrative data provided by specialized source agencies. Originally initiated with six sectors under a 1993-94 base series, the index expanded to eight industries under the 2004-05 revision. From June 2026 onwards, the new series will replace the existing series of ICI with base year 2011-12.
India’s Index of Core Industries rose by 5% in June 2026. Iron ore recorded a sharp 43.9% increase, while electricity and cement each expanded by 9.8%. In contrast, the index of production for crude oil, natural gas, fertilizer and refinery products contracted. This mixed performance raises the question of whether infrastructure expansion is outpacing broader productive capacity and, if so, what policy steps should follow.
Sectoral growth can be assessed on both a year-on-year (YoY) and a month-on-month (MoM) basis. In June 2026, YoY gains were registered by steel (4.6%), cement (9.8%), electricity (9.8%), iron ore (43.9%) and coal (1.4%). Declines occurred for natural gas (-7.4%), crude oil (-4.2%), refinery products (-4.7%) and fertilizers (-3.3%).
The continuing Iran–U.S. conflict has contributed to the weakness in segments that depend on oil and gas imports from West Asia. Compared to June 2025, YoY growth in cement, electricity, iron ore and coal accelerated in June this year, whereas for steel it decelerated. Much of this improvement appears linked to the front-loading of capital expenditure by the Centre: central capex rose nearly 13.4%, from INR 221,354 crore in April–May 2025 to INR 251,003 crore in the same period of the current year (as per the May 2026 Report).
On a month-on-month basis, June 2026 saw declines in natural gas (-5.22%), crude oil (-3.44%), steel (-1.38%), electricity (-0.53%), iron ore (-0.27%) and the overall index (-0.42%). Positive MoM movements were recorded by coal (2.48%), refinery products (0.40%), fertilizers (1.09%) and cement (4.30%).
Instead of concentrating on simply roads, highways and flyovers, India’s infrastructure development can be in areas like social infrastructure (health centres, dispensaries, rural roads that commoners use, primary and secondary schools, libraries, technological institutes, etc.) and strategic infrastructure (integrated port-rail networks, strategic petroleum reserves, etc.).
MS: India has traditionally treated migration as a consequence of development. Should the economy now treat internal migration as an economic strategy—and build housing, transport, social security and portable benefits —- around workers rather than their states of origin?
SG: Migration forms an integral part of human life and serves as a deliberate strategy to secure improved living conditions and opportunities. In the aftermath of the 2020 lockdown, the Ministry of Labour and Employment launched the e-Shram portal in August 2021 to create a comprehensive national database of unorganized workers, including self-declared migrant workers, construction labourers and gig workers. As of 26 July 2026, 31.82 crore workers had registered on the portal.
Two principal legal obstacles continue to hinder access to social welfare for inter-state as well as intra-state migrant workers: the requirement of identity proof and proof of residential address. Following the Special Intensive Revision (SIR), migrant workers must now establish their eligibility both as voters and as citizens in order to receive government welfare benefits.
Data from the Periodic Labour Force Survey (PLFS) 2020-21 indicate an overall national migration rate of 28.9%, marked by a sharp gender disparity—47.9% among females against only 10.7% among males. The motivations underlying these movements differ significantly by gender. Male migration is predominantly economic, driven primarily by the search for employment or better job prospects (22.8%). In contrast, female migration is overwhelmingly social, with marriage accounting for 86.8% of female relocatees. These patterns highlight a clear bifurcation in Indian migration: labour market aspirations for men and marital transition for women.
Legislation enacted in favour of migrant workers is unlikely to deliver meaningful results in the absence of adequate budgetary allocations and effective checks and balances. Bureaucratic obstacles, both among states and between the Centre and the states must also be addressed.
Kerala has set a pioneering example by designating interstate migrant workers as “guest labourers” (Athithi Thozhilaikal) and becoming the first state in India to introduce a comprehensive social-security framework for unorganised labourers. Its key initiatives include the Awaaz Health Insurance Scheme for medical coverage and the Apna Ghar Scheme, which offers safe and affordable rental housing. To promote social integration, the state also runs Malayalam and Hindi literacy programmes, provides native-language tutors for migrants’ children and implements targeted health outreach through the Link Worker Scheme.
A decentralized approach is essential, in which states retain decision-making and implementation authority while the Centre provides the necessary financial support. At the heart of development, whether planned or unplanned, are the people. Prioritising investment in human capital by both government and non-government actors remains critical.
MS: Coal-based thermal power supplied about 69.5% of India’s electricity from April to June 2026, despite rapid renewable-energy expansion. Is India’s real challenge now not coal versus renewables, but securing enough reliable power for industrialisation?
SG: With the recent escalation of the Iran-US conflict in West Asia, supply disruptions have driven Brent crude prices close to US$100 per barrel. In response to these conflict-driven energy shortages, the Central Government is focusing on national energy security by accelerating a shift toward coal gasification, supported by incentives amounting to INR 46,000 crore aimed at reducing import dependence. More than 35 companies are expected to launch coal gasification projects in 2026, aided by efforts to close technology gaps and capitalize on India’s status as the holder of the world’s fifth-largest coal reserves. The INR 25,016 crore Lakhanpur coal gasification project in Jharsuguda, Odisha, is projected to advance industrial self-reliance and the goal of an Aatmanirbhar Bharat.
India holds significant domestic reserves of 389.42 billion tonnes of coal and 47.29 billion tonnes of lignite as of 1 April 2024. These currently satisfy about 55% of the nation’s energy needs and remain central to its energy security. Domestic coal output hit a record 997.826 million tonnes in 2023-24, an 11.71% rise from the previous year. The government intends to further boost production through measures such as commercial mining auctions, the Mines and Minerals (Development and Regulation) Amendment Act, 2021, single-window clearances and the use of high-capacity technologies like Continuous Miners and Surface Miners. Sustainability remains a priority via mandatory Environmental Impact Assessments, Environment Management Plans, ongoing compliance checks, large-scale plantation and bio-reclamation, community use of mine water, eco-park development and energy-efficiency initiatives, so that expanded domestic coal production for energy security proceeds in an environmentally responsible way.
Rising industrial activity, growth in services and severe summer heatwaves are expected to drive a 7% rebound in India’s electricity demand in 2026, with peak grid demand projected to reach a record 270.8 GW in late May. In July 2026, the country’s energy transition recorded a landmark when variable renewable energy—primarily solar and wind—exceeded 100 GW in national power supply for the first time. A 25% jump in solar and wind generation helped displace gas-based output and shielded domestic wholesale electricity prices from global LNG volatility. However, sharp declines in solar generation during evening peak demand continue to pressure the grid, increasing dependence on thermal power and underscoring the need for greater grid flexibility and battery storage capacity.
Installed renewable energy capacity per capita has grown from 64.04 watts in 2014-15 to 104.65 watts in 2020-21 and further to 193.36 watts in 2025-26. The share of renewables in total installed electricity generation capacity has risen from 16.02% in 2015-16 to 25.97% in 2025-26. Industrialization clearly requires reliable power, preferably from cleaner sources.
The Union Cabinet has approved India’s updated Nationally Determined Contribution for 2031–2035, consistent with the Viksit Bharat @2047 vision and the 2070 net-zero goal. Having already met its earlier 2030 climate commitments ahead of schedule—reaching 52.57% non-fossil power capacity by early 2026—India has elevated its 2035 targets to cut GDP emissions intensity by 47% from 2005 levels, attain 60% non-fossil installed power capacity and expand its carbon sink to 3.5–4.0 billion tonnes of CO2 equivalent by 2035.
MS: India is attracting global capital, expanding manufacturing and preparing for AI and automation. If AI reduces the advantage of low-cost labour in sectors that traditionally created middle-class jobs, what should be India's development strategy before automation causes a major labour-market shock? Which sectors should India prepare for the next decade and how?
SG: Two technological developments are reshaping labour markets across the world: artificial intelligence (AI) and automation through robotics. Countries experiencing labour shortages, such as Japan and South Korea, stand to benefit significantly from automation as it helps offset shortage of workers and sustain productivity. At the same time, AI is transforming the nature of work by enhancing efficiency, accelerating decision-making and improving productivity across a wide range of industries.
However, the adoption of AI also entails substantial costs, including investments in computing infrastructure, software, skilled personnel and continuous system maintenance. In an economy like India, where real wage growth has remained modest in several sectors over the past decade, firms—particularly labour-intensive enterprises—may continue to rely on relatively inexpensive human labour where it remains more cost-effective than automation. Moreover, AI systems require a skilled workforce comprising software engineers, machine learning specialists, data scientists and cybersecurity professionals for their development, deployment and maintenance.
India is currently a major adopter of AI technologies while gradually building its own AI ecosystem through public and private initiatives. Although the government has launched programmes such as the IndiaAI Mission and issued policy guidance through NITI Aayog, India does not yet have a comprehensive AI-specific legal and regulatory framework. Policymakers could draw lessons from the experiences of countries such as the United States and China in designing an ecosystem that encourages AI-driven innovation while balancing productivity gains with employment generation and workforce reskilling.
The IT and IT-enabled services (ITeS) sector may face significant disruption in the near term, particularly in routine coding, testing, customer support and back-office operations. According to Morgan Stanley, AI-driven disruption could slow the annual growth of India's IT services exports to around 4.4%, compared with an average growth rate of 9.8% over the previous five years.
At this stage, however, it is difficult to predict the full extent of AI's impact across different sectors of the economy. While some occupations are likely to be displaced or transformed, AI is also expected to create new industries, occupations and business models that are difficult to foresee today, much as previous technological revolutions generated entirely new forms of employment. AI need not always be labour-displacing; it can complement human expertise.
MS: India is creating more detailed household, labour and enterprise datasets. But more data does not automatically mean better policy. How should India independently reconcile conflicting estimates before major policies rely on them? What should a credible Indian economic-data architecture look like?
SG: Triangulation in labour market data collection refers to the use of multiple sources of information to measure and validate the same phenomenon, thereby improving the accuracy, reliability and completeness of the data. In the context of employment statistics, triangulation typically involves collecting data from workers, households and enterprises, each of which provides a distinct perspective on labour market conditions.
Combining these three sources allows researchers and policymakers to cross-verify information and identify inconsistencies that may arise from reporting errors, sampling limitations or differences in survey coverage.
For example, if household surveys indicate rising employment while enterprise surveys show little increase in formal hiring, the discrepancy may suggest that employment growth is occurring primarily in the informal sector or through self-employment. Similarly, wage data reported by workers can be compared with enterprise payroll records to assess the consistency of earnings estimates. Since each data source has its own strengths and limitations, triangulation helps compensate for the weaknesses of any single dataset. Household surveys are better at capturing informal and self-employed workers, enterprise surveys provide detailed information on registered firms and labour demand and worker-level surveys offer insights into job quality and working conditions.
Triangulation also strengthens evidence-based policymaking by providing a more comprehensive understanding of labour market dynamics.
Rather than relying on a single survey, triangulation integrates evidence from the supply side of the labour market (workers and households) with the demand side (enterprises), thereby producing stronger and credible labour market statistics. As a result, it is widely regarded as an international best practice for improving the quality of employment data and supporting informed policy decisions.
A comparable example is provided by the Reserve Bank of India (RBI), which adopts a multi-perspective approach to economic assessment. On the one hand, it conducts bi-monthly Rural and Urban Consumer Confidence Surveys to gauge households' perceptions and expectations regarding the economy. On the other hand, it undertakes the Industrial Outlook Survey to capture the sentiment and expectations of manufacturing firms. Together, these surveys enable the RBI to assess economic conditions from both the consumer and producer perspectives, facilitating a more balanced and comprehensive understanding of the economy.
MS: If you had to design India’s next five-year socio-economic strategy today, what would come first: people, productivity, places or data? How should India prioritise human capabilities, productivity, economically stronger cities or better measurement of progress—and why?
SG: People lie at the heart of public planning, yet economists cannot directly consult everyone due to time and practical constraints. Instead, they rely on survey designs developed by statisticians from sampling frames, combining survey insights with budgetary analysis to formulate policy recommendations. Lawmakers and policymakers then draft regulations through consultations, which in mature democracies often mandate pre-legislative reviews and white papers. Effective governance hinges on robust progress measurement.
India's National Indicator Framework streamlined its Sustainable Development Goal (SDG) indicators from 306 in June 2019 down to 277 by June 2026 across all 17 goals.
Evaluations like the Open Data Inventory (ODIN) 2024 highlight structural gaps in statistical output. Ranking 105th out of 198 countries with an overall score of 54 (52 for coverage and 55 for openness), India performs relatively well in statistics such as money and banking, international trade, balance of payments and energy. However, it records comparatively weaker scores in areas including gender statistics, poverty and income, health outcomes and population and vital statistics.
The ODIN report identifies gaps in the availability of long time-series data, subnational statistics and disaggregated datasets, although it notes that India's data are generally accessible in machine-readable and downloadable formats. The report further highlights that India has an enabling legal framework for open data, including statistical, copyright, right-to-information and data privacy laws and has adopted a national data strategy while subscribing to the IMF's Special Data Dissemination Standard (SDDS). However, India has not adopted the Open Data Charter and is not a member of the Open Government Partnership, indicating scope for strengthening international commitments to data openness. The report concludes that improving data licensing, metadata, subnational coverage and the publication of more disaggregated statistics would significantly enhance the accessibility, transparency and usability of India's official statistics for researchers, policymakers, businesses and the general public.
MS: The Sustainable Development Goals were adopted by all United Nations Member States in 2015 as part of the 2030 Agenda for Sustainable Development, providing a shared blueprint to end poverty, reduce inequality and tackle climate change. India developed its own National Indicator Framework to monitor progress in a manner suited to its national context and has been regularly tracking performance through official reports. How much progress has India made in attaining the SDGs?
SG: According to the Sustainable Development Goals National Indicator Framework Progress Report 2026 of MoSPI, India has made substantial gains across social, economic and infrastructure dimensions.
Despite these positive trajectories, key challenges persist across targeted health, environmental and institutional indicators.
List of Key References for the Statistical Data Listed in the Interview
About Shambhu Ghatak
Shambhu Ghatak has more than two decades of experience in economic analysis, policy research, forecasting and data-driven insights spanning India. He is currently Deputy Vice President – Economist at Systematix Group, monitoring macroeconomic and external sector trends. Until recently, he served as Public Policy Research Lead at Citizens Alliance and Research Consultant on unconditional cash transfers for Project DEEP. Earlier, he worked at the Centre for Strategic and Policy Studies in Brunei, contributing to the Brunei Economic Outlook 2024 and policy briefs on economic diversification and Wawasan 2035. For over a decade at Common Cause and CSDS, he specialised in data journalism, high-frequency indicators, budgets and inclusive development through the Inclusive Media for Change project. He holds an M.Phil. and M.A. in Economics from Jawaharlal Nehru University and a B.Sc. (Hons.) from the University of Calcutta. His research papers and articles on MSMEs, food security, inflation and public finance have been widely cited and informed policy discourse.
About the Interviewer
Mahima Sharma is an Independent Senior Journalist based in Delhi NCR with a career spanning TV, Print, and Online Journalism since 2005. She has played key roles at several media houses including roles at CNN-News18, ANI, Voice of India, and Hindustan Times.
Founder & Editor of The Think Pot, she is also a recipient of the REX Karmaveer Chakra (Gold & Silver) by iCONGO in association with the United Nations. Since March 2022, she has served as an Entrepreneurship Education Mentor at Women Will, a Google-backed program in collaboration with SHEROES. Mahima can be reached at media@indiastat.com
Disclaimer : This interview is the personal opinion of the interviewed protagonist and not those of the organisation he/she works for. The facts and opinions appearing in the answers do not reflect the views of Indiastat or that of the interviewer. Indiastat does not hold any responsibility or liability for the same.









.png)